
This is the second post in a series of five. In previous post, we discussed the need to keep it simple, if you want your CRM to provide return on your investment. In this post, we focus on the data your CRM system can generate (either with you or for you). Consistent data points you in the direction the business is heading. Inconsistent data does not necessarily point you in the wrong direction, it points you in different directions.
Rule 2: Keep it Consistent

The law of averages in large numbers
When you have two watches, each displaying a different time. which is right? If all you have is watches, a degree of certainty can be derived from a median "window of time" - most watches are displaying time within a small time interval of a few minutes apart. Alternatively, you need to calibrate against a trusted external source. The data you use to forecast your revenue is no different. You need a significant number of deals in the pipeline to get a sense of forecast. Next to the number, it also needs to be a consistent process (or a consistent set of processes, see previous post - Rule 1: keep it simple).
The accuracy of the average
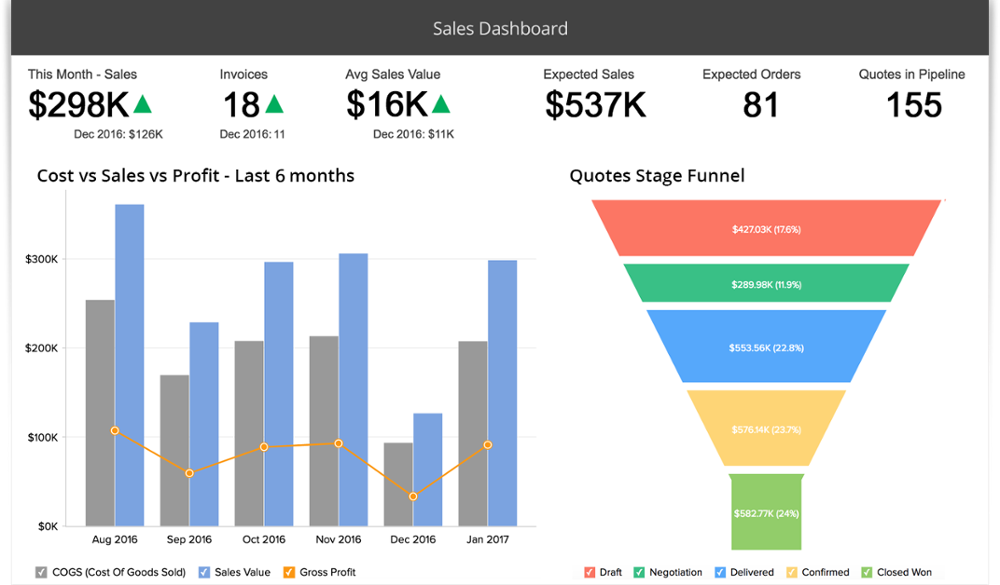
You probably know the game where the contestants have to guess the number of jelly beans in a jar. When enough contestants have put in their "guestimate", it is the average of all these entries that consistently is remarkably close to the actual number of jelly beans in the jar. When having a sales forecast meeting, it is about the comprehensive deal portfolio, the combined forecast of numbers, not the individual deal weighting. This deal weighting is set by experience to a certain sales stage. For example, in a sales process, the historical data indicates that 9% of all deals that are qualified go all the way through the process to won. And the next stage - say "Needs analysis" will have 21% of the deals close to a win. Your CRM can be configured to show these forecasted percentages against the deal stage. When you are just starting to build this data, don't worry too much on the stage percentages - you can analyse that data as you work your sales cycles - start with standard rounded percentages (i.e. qualify = 10%, etc.). You might ask: "What about the probability set by the sales representative? Surely they know best what is going on in the deal?" The answer is two-fold. First, yes! Your sales representative should know best what's going on in the deal. But how relevant is that? And that brings us to the second part of the answer - if the deal is just "one of many", then the law of averages in large numbers simply applies. If the deal in itself is an outlier - a few times larger than the regular sized deals - you should take the confidence adjustments suggested as either upside or downside forecasts. this gives you an estimate range of the revenue. Example: a pool of 50 deals with an average deal size of $10.000, and one deal of $500.000 - the latter posing a significant risk on the forecast if unattended. The sales representative is highly confident it will close within the prospected time (say 80% certain, based on the current buying signals). The stage is set at 60% certainty. In the standard forecast the deal is in for $300.000, and with the confidence of the sales representative, it has an upside $400.000. The flipside is also true - if the sales representative does not get the buying signals, the confidence can be any percentage lower than the sales stage (except 0% - that is a close lost, or qualify out scenario). Let's say the sales representative sets the confidence at 15% - the forecast is then $300.000 with $225.000 at risk (15% of $500.000 is $75.000, the difference between the generated forecast and the sales representative's call is the at risk amount).
A process that works is a process that is followed
To get consistent data, you need a consistent process. It is that simple. The process should be aligned with how much a customer is willing to accommodate the sales process in their buying process. In the previous post, we talked about the five main categories of sales processes, and the principle of LESS. Create your sales processes along these criteria as needed - and not all 5 need apply. Keeping the steps logical and limited to the necessary and helpful, you'll find it easier for the sales people to follow. That leads to better data and therefore better forecasts.
A blueprint
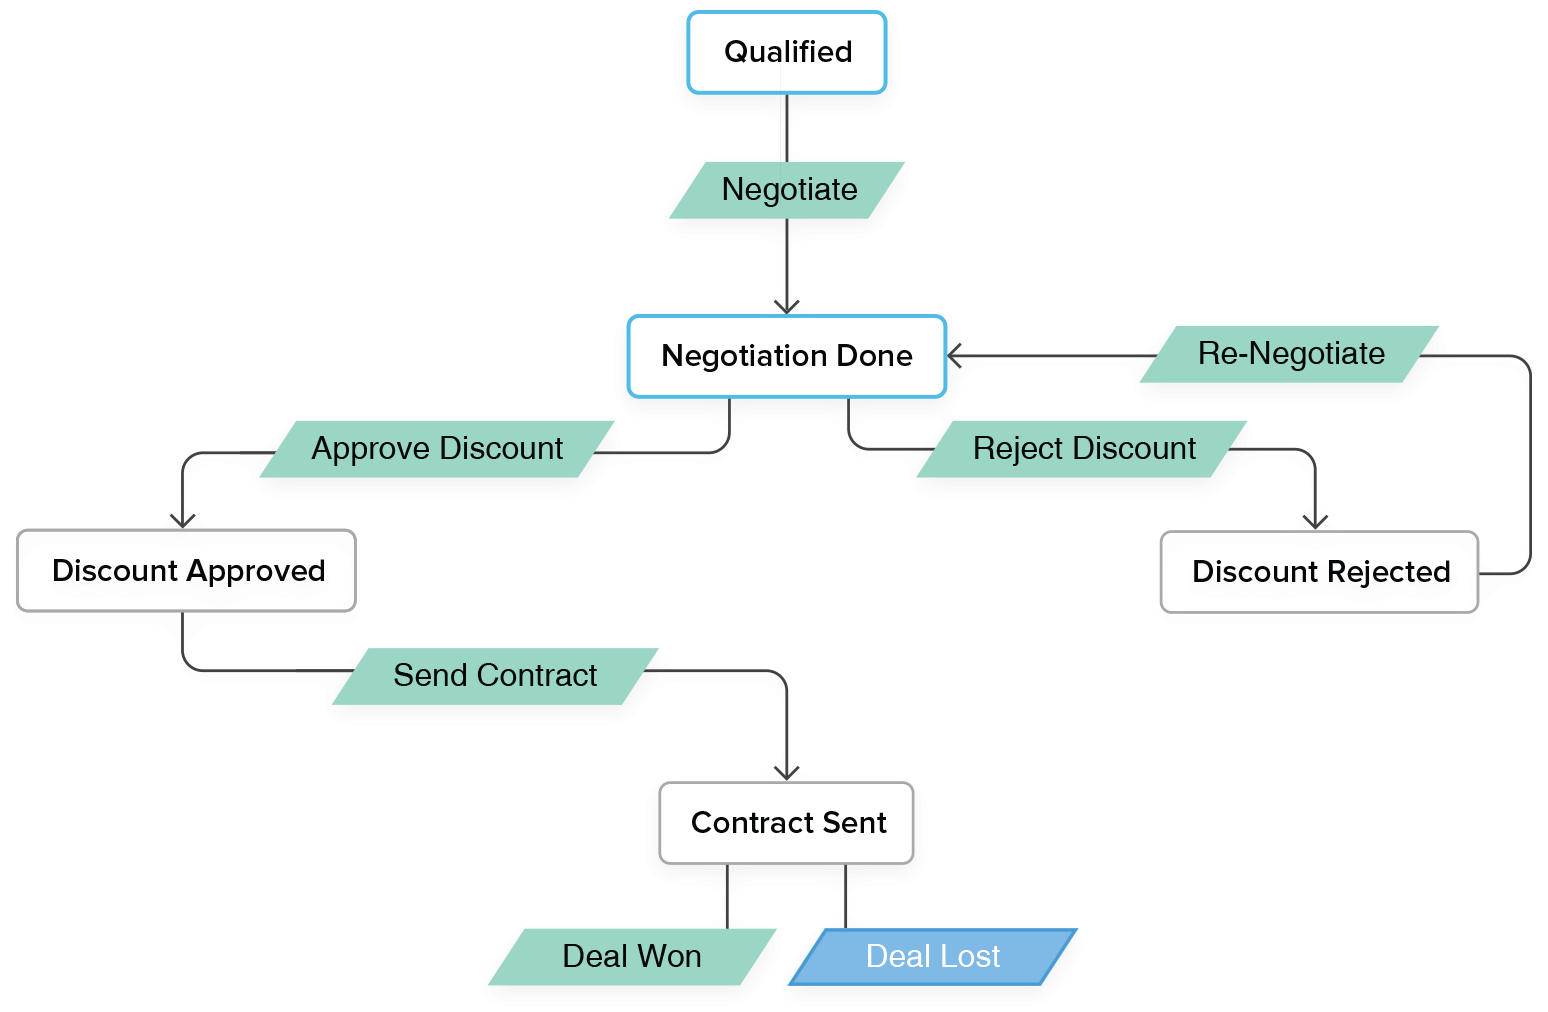
Zoho CRM (Professional and Enterprise Edition) have a blueprint functionality. Blueprints allow you to set the sales process fitting for the deal type, and guide the sales people through it. The blueprint is a powerful feature in any CRM to guide a sales team through sales cycles of various complexity.
Conclusion
Data you generate in CRM has multiple purposes - from individual account level (the "360 degree view") to market segment analysis and sales forecasting. Although this post predominantly focuses in the sales forecasts, the rule for consistency applies to segmentation as well as individual customer view (like the one watch - without a process that is calibrated, you are not exactly clear what you are looking at - what the data tells you). This article builds on the previous article: you have something that is simple, understandable, and analysable; now you must focus to keep it consistent to make it valuable.
If you are looking to introduce enterprise grade CRM discipline into your organisation, without introducing the enterprise price tags or the enterprise headache, sign up for a free trial of Zoho CRM today. Aurelian Group is ready to assist or guide you in your journey.